| Most Endangered Rivers of the USA – American Rivers | ||||
| A map series showing the ten most endangered Rivers in the USA was published by American Rivers for their 2010 campaign. On the American Rivers website the report was announced as follows: | 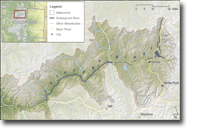 |
|||
| “American Rivers today released its most anticipated report of the year, America’s Most Endangered Rivers of 2010. The 25th anniversary edition of the report spotlights ten rivers facing the most urgent threats, and also features key endangered river success stories from the past two decades.” | ||||
| Antarctica Satellite Image Slides – 2041 | ||||
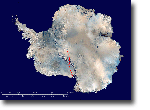 |
This set of slides where done for British Explorer and Global Environmental Activist Robert Swan and his non-profit organization 2041 to help promote his 2012 expedition. Robert Swan is the first person who walked to both poles, South and North. | |||
| Twentyfive years after he reached the South pole and 100 years after Amundson and Scott he is planning another expedition called ‘the return journey 2012’: to reach the edge of the Antarctic continent starting from the South Pole (the opposite way he went 25 years ago) – this time without using any fossil fuels. Read more about the great work of 2041. | ||||
| Global Warming Scenario for the Pacific NW of the USA – American Rivers | ||||
| This map for American Rivers shows Global Warming Scenarios for the Columbia River Basin in the Pacific NW of the USA. The data used for the map are from the Climate Impacts group of the University of Washington (2007). | 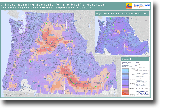 |
|||
| The main map shows the potential warming for the year 2070 and the inset map shows the August mean Surface temperatures averages for 1980 – 1997. The main goal of the map was to visualize the potential temperature changes in salmon habitats throughout the Columbia River Basin. | ||||
| Hydropower Dams Licensing – Hydropower Reform Coalition | ||||
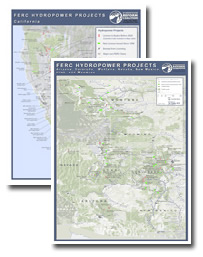 |
Hydropower dam re-licensing represents an important opportunity for river restoration. This map series is about hydropower dams and related licensing information. The maps classify FERC (Federal Energy Regulatory Commission) regulated dams into several categories, such as exempt from licensing, recently licensed, and imminent or future opportunity (depending on the year when the license expires). The maps visualize location, project and licensing information in a way | |||
| that allows the Hydropower Reform Coalition to plan for current, near term and future opportunities to take action regarding the issuance of new licenses, and related mitigation & restoration measures. | 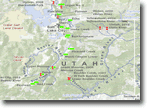 |
|||
| The first maps of the series where created at CommEn Space, the last ones completed by Terra GIS. Currently 4 maps including California, US Pacific Northwest, US Southeast, and Hydropower Dams Rockies have been completed. | ||||
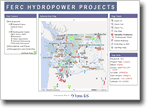 |
A pilot study by Terra GIS illustrates the integration of the map data into a hydropower web mapping application for use as a dynamic information system. | |||
| The Wenatchee Watershed Vision – The Trust for Public Land | |||||
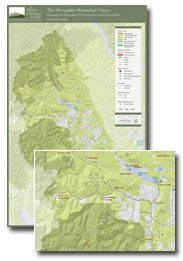 |
The Wenatchee Watershed Vision is a conservation vision plan for the Wenatchee River Watershed. The main focus is on the areas stretching from Leavenworth to Wenatchee. The report includes 16 maps that were created by Matt Stevenson (CoreGIS), Karsten Vennemann (now Terra GIS) and Erica Simek (now The Nature Conservancy). | ||||
| All maps shown here where created by Karsten Vennemann of Terra GIS. Base maps in the report include public and protected lands, working lands and recreation. | 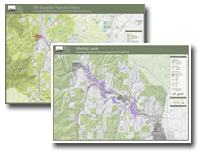 |
||||
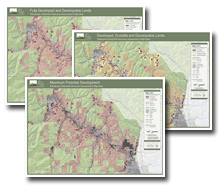 |
One part of the report is about evaluation of future housing developments. The maps to the left show part of the results of an comprehensive analysis that included analysis of developed, divisible & developable lands, and modeling of maximum potential development that likely will be affected the most by future housing developments. | ||||
| The maps to the right illustrate easements for public fishing access on private parcels along the Wenatchee River. Until recently restrictions on fishing have been in place. Read more about the report here. | 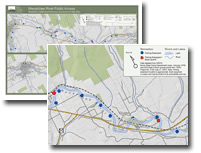 |
||||
More sample maps
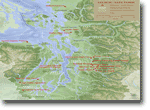 |
Salmon-Safe Certified Farms – Stewardship Partners Salmon – Safe is an eco-label certification program that evaluates farms regarding their adoption of fish-friendly conservation practices and participation in salmon habitat restoration. The base for this web click-able map was created by Karsten Vennemann at CommEn Space. |
|
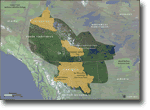 |
Alaska – Satellite Image map Example for a map using satellite imagery and transparent vector overlays. |
|
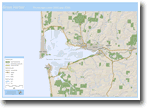 |
Protected Lands – Pacific Coast Joint Venture The map shows protected lands in 1990 and 2006 in and around Grays Harbor on the Washington coast. |
|
